For proper analysis of a server or a system, logs play a very important role. By reading logs we can know about system incidents which happened in a particular time. Logs help us to detect the problems in the system and troubleshoot the problems. Logs are generally stored in files. For different services different log files are generated. If we have many systems and we need to analyze the logs,then it will be difficult to manage all the logs. So it is best practice to store the logs in a centralized sever.
As logs are saved in files, sometimes it is hard to analyze the data in text format. If we can extract the data from logs and convert the data in table, graph, pie-chart form it will be easy for us to analyze the data. It is easier to analyze the data in detailed picture form rather than reading the text based log files.
In case of apache log, contents of the log file increases every time some one visit the website. So for proper analysis we should able to read the logs in real time. So the centralized server should be able to fetch the data from the servers in real time.
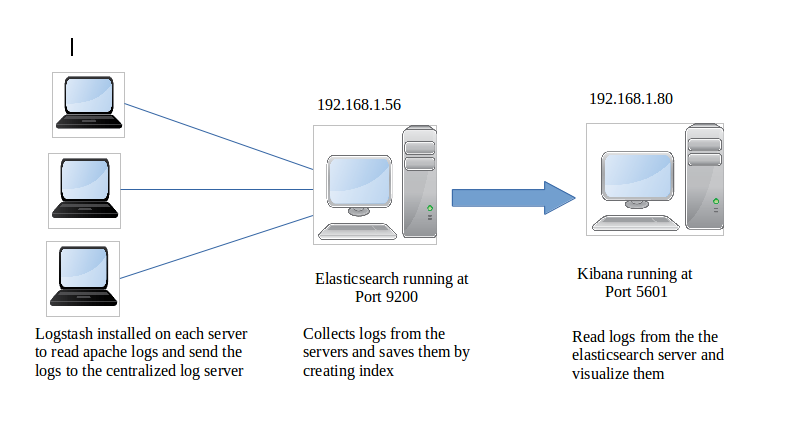
The above requirements are fulfilled by the ELK (Elasticsearch, Logstash and Kibana) stack. Elasticsearch is used as a centralized log server where as Logstash is used to send log data to Elasticsearch in real time. Kibana is used for view the complex log data in picture form.
In this tutorial I will show you how to setup ELK stack. I am using ubuntu 14.04 in all the servers.
Setting up ELK stack
Suppose I have 3 different servers running apache service and I need to get the log files from each server. So, I need to setup Logstash in each of the server. Logstash will read the apache log files and send it to the Elasticsearch server. Elasticsearch will save the logs in unique index defined by the Logstash. I need another server which will use Kibana to fetch the data from the Elasticsearch and visualize the data.
Install Java
The ELK stack needs java to run the applications. So you need to install java in all the servers. Before installing any of the application make sure Java is installed.
|
1 2 3 4 5 6 7 |
sudo apt-add-repository ppa:webupd8team/java sudo apt-get update sudo apt-get install oracle-java8-installer #verfify your java version java -version |
Install Kibana
Login to you server where you want to setup kibana
|
1 2 3 4 5 6 |
# Download the deb package for ubuntu sudo wget https://artifacts.elastic.co/downloads/kibana/kibana-5.1.2-amd64.deb sudo dpkg -i kibana-5.1.2-amd64.deb |
Open /etc/kibana/kibana.yml and change the following.
|
1 2 3 |
server.host: "192.168.1.80" # IP of the Elasticsearch server elasticsearch.url: "http://192.168.1.56:9200" |
Now, restart the kibana service.
|
1 |
sudo service kibana restart |
Install Elasticsearch
Login to your server where you want to setup Elasticsearch
|
1 2 3 4 |
# Download the deb package for ubuntu sudo wget https://artifacts.elastic.co/downloads/elasticsearch/elasticsearch-5.1.2.deb sudo dpkg -i elasticsearch-5.1.2.deb |
Open /etc/elasticsearch/elasticsearch.yml and change the following.
|
1 2 |
network.host: 192.168.1.56 |
Now,restart the Elasticsearch service.
|
1 |
sudo service elasticsearch restart |
Install Logstash
You need to install Logstash for each server. Installation and configuration is same for all the server, you just need to define different index name for Elasticsearch.
|
1 2 3 |
# Download deb package for ubuntu sudo wget https://artifacts.elastic.co/downloads/logstash/logstash-5.1.2.deb sudo dpkg -i logstash-5.1.2.deb |
Create a file /etc/logstash/conf.d/apache.conf and copy the following content.
|
1 2 3 4 5 6 7 8 9 10 11 12 13 14 15 16 17 18 19 20 21 22 23 24 25 26 |
input { file { # Give path to your log file path => '/var/log/apache2/mysite_access.log' } } filter { grok { #match => { "message" => "%{COMBINEDAPACHELOG}" } match => { "message" => "%{NOTSPACE:clientip} \- \- \[%{NOTSPACE:date} \+%{INT}\] \"%{WORD:method} /%{NOTSPACE:request} %{NOTSPACE:httpversion}\" %{INT:response} %{INT} \"%{NOTSPACE:fullurl}\" \"%{GREEDYDATA:misc}\"" } } } #output { # stdout { codec => rubydebug } #} output { elasticsearch { # Elastic server IP and port hosts => ["192.168.1.56:9200"] # choose an index name index => "client1-apache" } } |
For different server change the index. Make sure the path to the log file is correct in the input section. In filter section you can define your own pattern and get the logs in key value format.
Now, restart the Logstash service and use the configuration file we wrote for sending logs to Elasticsearch.
|
1 2 |
sudo service logstash restart sudo /usr/share/logstash/bin/logstash -f /etc/logstash/conf.d/apache.conf |
If there is no error in configuration, you will see output like this

Now, In the browser open Kibana server, in my case it is http://192.168.1.80:5601.
Go to Management -> Index Patterns -> Add New and add your index name., the index name you added in the logstash configuration file.
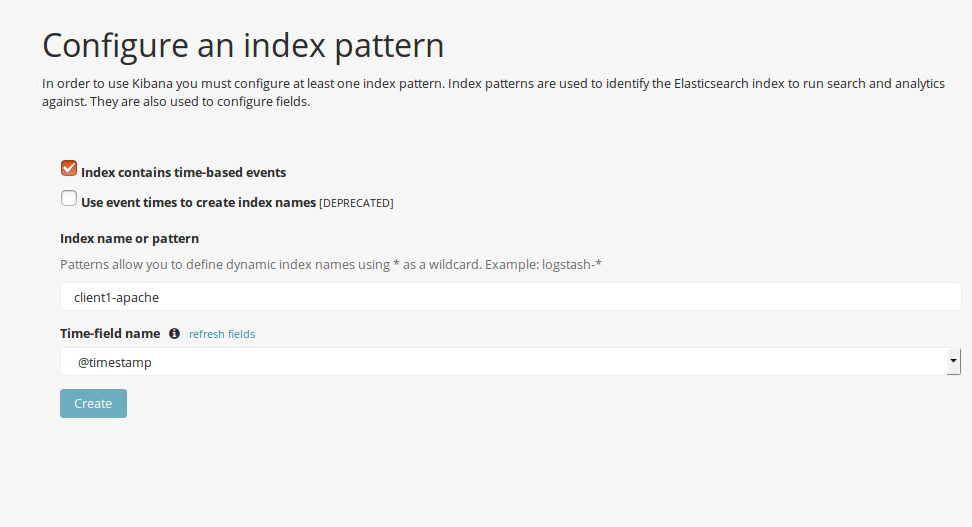
After you create your index you can able to visualize your logs in Kibana Dashboard. Do this for other servers also and you will be able to view logs by index name. If you have any query regarding ELK stack setup, you can ask me in the comment.
IN CASE OF ANY QUERY,CONTACT US